Safety Facts
Motor vehicle crashes are a leading killer of children.
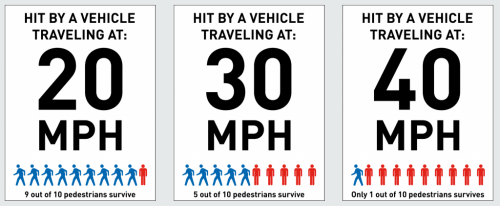
Speeding is the most common traffic rule violation and contributes to motor vehicle accidents every single day.
2016 Data NHTSA:

Interesting Findings
TRAFFIC SAFETY CULTURE INDEX – The AAA Foundation of Traffic Safety
The AAA Foundation for Traffic Safety has been committed to deepening our understanding of our nation’s traffic safety culture. The tenth Traffic Safety Culture Index identifies key indicators regarding the degree to which traffic safety is valued and pursued by U.S. drivers. Much like in previous years, the 2017 traffic safety culture index reveals motorists’ discordance between traffic safety culture beliefs and actual driving behavior. The results continue to show an attitude of “do as I say and not as I do” among motorists.

2017 Key Findings

Distracted Driving

Risky and Aggressive Driving Behaviors

METHODS
The 2017 traffic safety culture index is a sample of 2,613 U.S. licensed drivers ages 16 and older who completed the online survey and reported having driven at least once in the past 30 days, weighted to reflect the U.S. population. Survey participants were asked questions regarding threats of certain behaviors to personal safety, acceptance, engagement to these behaviors, and support for laws and countermeasures. Data from the 2017 Traffic Safety Culture Index was collected between Oct. 14 and Nov. 17, 2017, and used a probability-based sampling panel representative of the U.S. population.


