Safety Facts

Motor vehicle crashes are a leading killer of children.

  • An average of 3 children aged 14 and younger are killed every day in traffic crashes.
  • 4-5 killed per week are child pedestrians.

Speeding is the most common traffic rule violation and contributes to motor vehicle accidents every single day.

2016 Data NHTSA:
  • Of the 37,461 motor vehicle traffic fatalities in the United States, 1,233 (3%) were children, an 8% increase from 2015.
  • 5,987 pedestrians were killed in pedestrian traffic crashes, and 245 (4%) were children.
  • 840 pedal cyclist traffic fatalities, 59 (7%) were children.
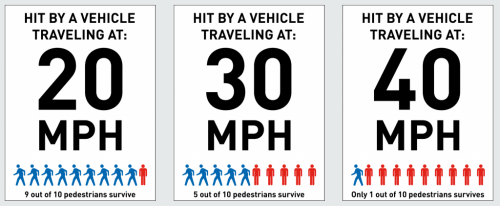
Here is the Different Types of Speeds Caused by Accidents

Interesting Findings

TRAFFIC SAFETY CULTURE INDEX – The AAA Foundation of Traffic Safety
The AAA Foundation for Traffic Safety has been committed to deepening our understanding of our nation’s traffic safety culture. The tenth Traffic Safety Culture Index identifies key indicators regarding the degree to which traffic safety is valued and pursued by U.S. drivers. Much like in previous years, the 2017 traffic safety culture index reveals motorists’ discordance between traffic safety culture beliefs and actual driving behavior. The results continue to show an attitude of “do as I say and not as I do” among motorists.
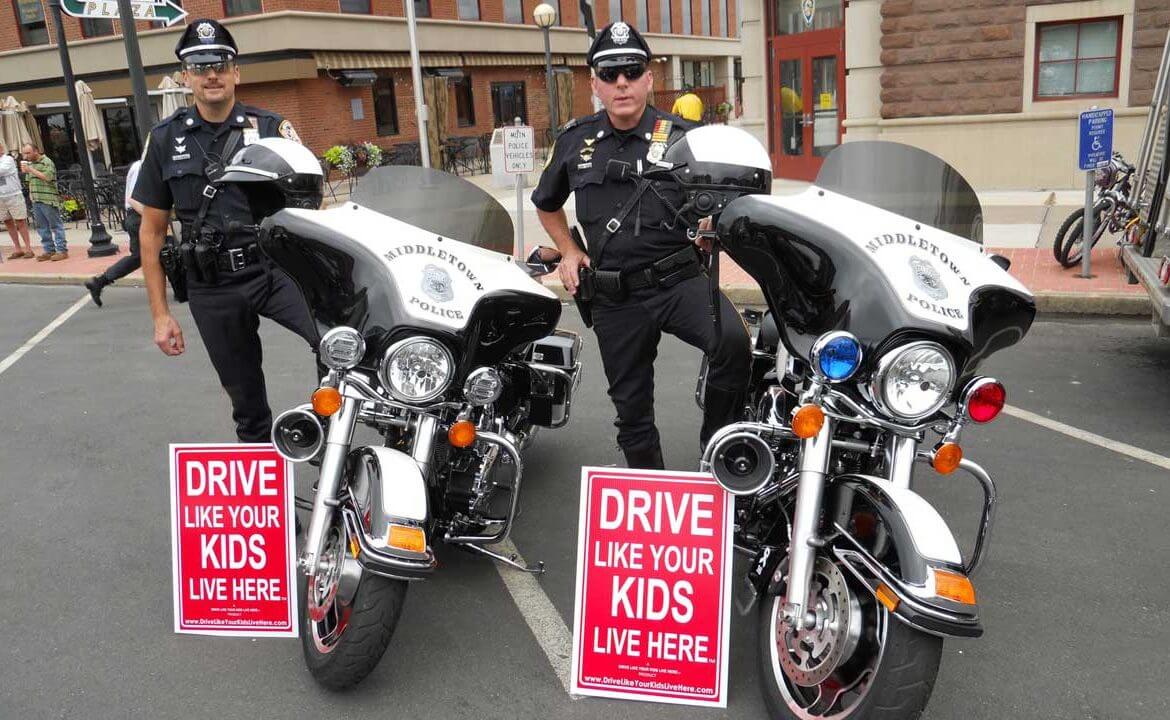
Cops With Drive Like Your Kids Live Here Board to Their Vehicles

2017 Key Findings

  • More than 1 in 5 (21.4%) drivers report having been involved in a motor vehicle crash in which someone had to go to the hospital, including 11.1% who have been seriously injured in a crash.
  • Nearly 1 in 3 (31.6%) drivers report having had a relative who was seriously injured or killed in a motor vehicle crash.
  • Most drivers (87.5%) perceive that distracted drivers are a bigger problem than years past. Moreover, distracted driving outpaced all other issues as a growing concern. It was followed by traffic congestion at 74.5%, then aggressive drivers at 68.1%, drivers using drugs at 54.9%, and drunk driving (43.4%).
Yard Sign 18×24 (4PK)

Distracted Driving

  • Cellphone use while driving is common. In the past month, 60.5% of drivers talked on a hands-free cellphone, while 49.1% talked on a handheld cellphone. Drivers are more accepting of hands-free cell phone use (69.0%) than handheld cellphone use (24.6%) while driving.
  • More view drivers texting or emailing while driving as a serious threat (96.8%) than drivers talking on cellphones (87.7%). However, in the past 30 days, 44.9% of drivers read a text message or email while driving and 34.6% of drivers typed or sent a text message or email while driving.
  • A majority of respondents (87.6%) support legislation against reading, typing, or sending a text message or email, and 73.4% of drivers support having a law against using a handheld cellphone while driving. However, only 40.9% support an outright ban on using any type of cellphone (including hands-free) while driving.
Drive Like Your Kids Live Here

Risky and Aggressive Driving Behaviors
  • Speeding on freeways and on residential streets is prevalent. Half of the drivers (50.3%) reported driving 15 mph over the speed limit on a freeway, and 47.6% reported driving 10 mph over the speed limit on a residential street.
  • There is greater social disapproval for speeding on a residential street than on freeways. Only 23.9% of drivers believe that driving 15 mph over the speed limit on a freeway is completely or somewhat acceptable, while only 14.0% of motorists deem driving 10 mph over the speed limit on a residential street as acceptable.
  • A large portion of drivers (42.7%) admitted to driving through a stoplight that has just turned red when they could have stopped safely in the past 30 days, despite most drivers (92.9%) viewing it as unacceptable behavior. In conjunction with this, an overwhelming majority (91.4%) of drivers perceive running red lights as a serious or somewhat serious threat to their personal safety. Drowsy Driving.
  • 42.4% of drivers have at least one or more days where they get less than six hours of sleep in a typical week.
  • The majority of motorists view drowsy driving as a serious or somewhat serious threat to their safety (87.9%) and unacceptable behavior (95.2%); yet around 3 in 10 (30.8%) admit to driving when they were so tired that they had a hard time keeping their eyes open at some point in the past month. Impaired Driving.
  • An overwhelming majority of drivers consider driving after drinking alcohol a serious threat to their personal safety (94.3%). However, 13.5% reported driving at least once in the past year when they thought their alcohol levels might have been close to or possibly over the legal limit.
  • A majority of drivers (90.8%) perceive people who drive after using illegal drugs to be either a very serious threat or a somewhat serious threat to their personal safety.
  • Most respondents supported requiring alcohol-ignition interlocks for drivers convicted of DWI, even for first-time offenders (79.9%), requiring built-in interlocks for all new vehicles (73.0%), and having a per se law for marijuana (82.9%).
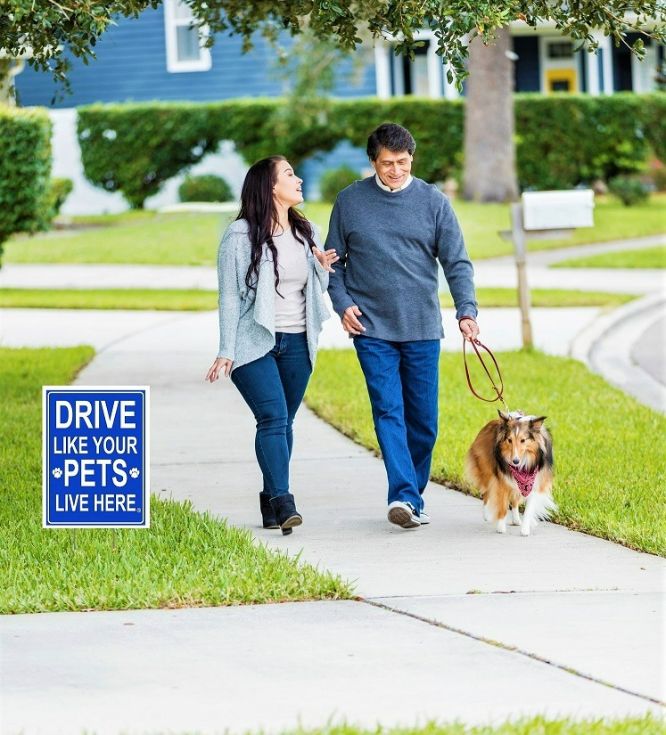
Pet Yard Sign 12×18 (2PK)

METHODS

The 2017 traffic safety culture index is a sample of 2,613 U.S. licensed drivers ages 16 and older who completed the online survey and reported having driven at least once in the past 30 days, weighted to reflect the U.S. population. Survey participants were asked questions regarding threats of certain behaviors to personal safety, acceptance, engagement to these behaviors, and support for laws and countermeasures. Data from the 2017 Traffic Safety Culture Index was collected between Oct. 14 and Nov. 17, 2017, and used a probability-based sampling panel representative of the U.S. population.
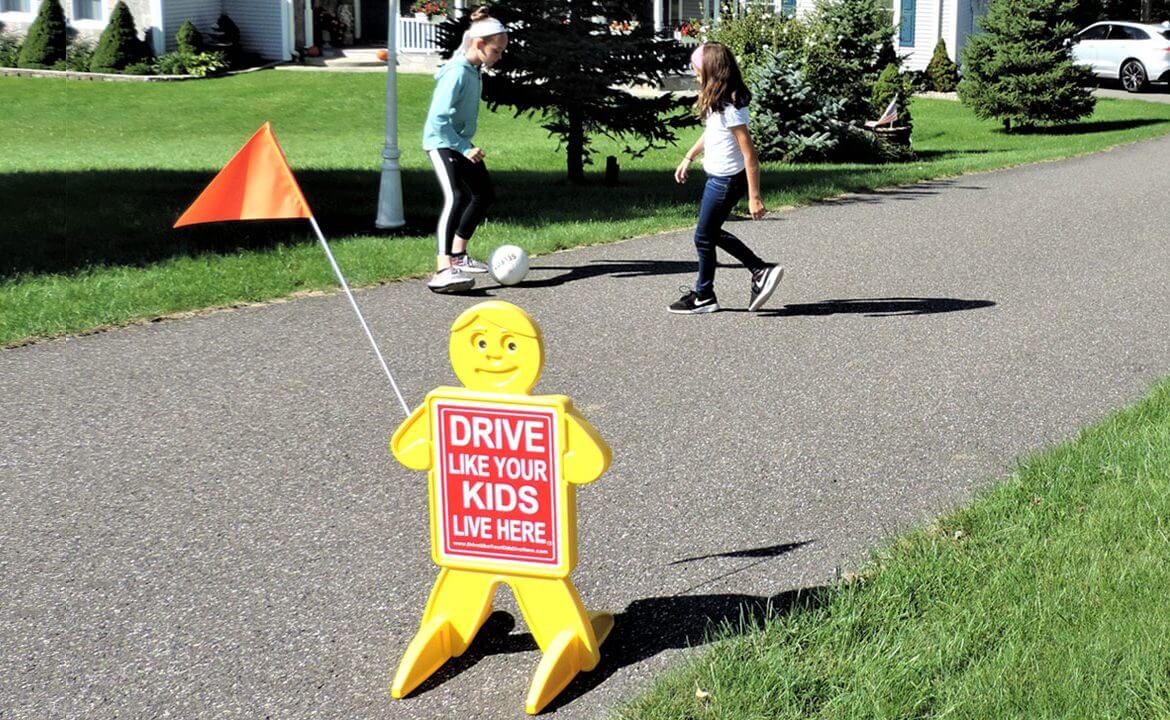
Two Children Playing Near Drive Like Your Kids Live Here Indicator